P/E Ratio and its limitations
-
By Team FinShiksha

FinShiksha Blogs are written either by the internal team or in collaboration with certain content writers.

Investors and analysts often seek comfort in explaining peer to peer comparison using a PE ratio formula (price to earnings ratio). The metric has always been popular and serves as a quick reference to review businesses of similar nature.
However, there have been certain inconsistencies and ambiguity in its usage and analysts have been selective while evaluating business models using this metric. Today we will understand the circumstances where price to earnings ratios may not be an effective tool for comparison in certain scenarios.
Exceptional Income
P/E ratio for Exide Industries Ltd stands at 2.89 Exide Industries Ltd sold its insurance business to HDFC Life. This is a one time earning. P/E ratio is currently based on artificially inflated profits.
Source: Screener.com
Now, if we subtract the exceptional income of INR 3,725 Crores from the Net Income of INR 4,367 Crores, we will get an adjusted net income of INR 642 Crores. Due to this adjustment, the EPS falls from INR 51.38 to INR 7.55.
As a result, the adjusted P/E will now become 19.60X.
Increase in revenue
Similarly, there is an increase in revenue for Aarti Industries which is an exceptional event. The notes to the financial statements stated that revenue from operations for the quarter and nine months ended December 31, 2021, is inclusive of accrual of termination fees of INR 63,125 Lakhs arising on account of termination of a long-term supply contract by the customer.
Source: Screener.com
If we adjust INR 631.25 Crores from the total revenue of INR 7,000 Crores, then the adjusted revenue becomes INR 6,368.75 Crores.
Subsequently the net profit for the year, which stands at INR 1,307 Crores, is now reduced to INR 675.75 Crores. EPS of the business, which was initially inflated at INR 36.06 is now almost halved to INR 18.64.
As a result, the P/E of Aarti Industries, which stood at 20.7X is now 40.07X
Registration Open - Analyst Program Click here
When assessing turnarounds
If a business shows accounting losses, it won’t be possible to evaluate the performance using the P/E ratio.
For instance, Healthcare Global Enterprises Ltd indicates that there is inconsistency in the net profit of the business.
Source: Screener.com
However, cash flow from operating activities shows consistent growth and improved business performance. In a situation like this, it will be difficult to evaluate the operations using P/E.

Source: Screener.com
Company sitting on top of operating leverage
Businesses spend significant amounts of money before their products generate sales. These are known as pre-production sales. Some businesses like chemical companies and manufacturing companies spend primarily on property, plant and equipment which they expense through depreciation over estimated useful life. On the other hand, tech and pharmaceutical companies spend heavily on R&D.
Pre-production costs dampen operating profit margins. Subsequently, sales growth leads to higher operating profit margins. Investors call this phenomenon operating leverage.
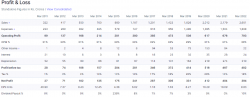
This can be better understood with the scenario of Laurus Labs. During Q4FY18, the management informed that their gross block of INR 2,000 Crores of revenue yields an asset turnover of 1:1 but more than 40 percent of the assets are not generating any revenue.
Similarly, during Q1FY19, the management informed that there are about INR 600 Crores of assets that are not contributing to the generation of revenue. Once these assets are utilized, there would be a positive growth in the ROCE and ROE of the company.
The P/E ratio during 2019 shows that the business is expensive and an investor would avoid considering this analogy.
Source: Screener.com
However as operating leverage plays out and the results of capex are visible, the net profit takes a steep rise.
A different perspective of looking at the data will be when the stock price was ~INR 79 in 2019 and the P/E was 44, it is important to note that the capacity utilization wasn’t optimized. Under such circumstances, while the P/E shows an expensive valuation, in theory it is relatively cheaper.
Source: Screener.com
Capex is not contributing to revenue generation
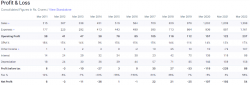
Syngene International Ltd. has a P/E of 53X. They have just commercialized the capex but regulatory approvals are pending. In other words, the plant has been set up but it has not contributed to sales at this point. Once the required approvals are obtained, the sales would commence.
It can be seen that depreciation has increased by 2X during the last 4 years from INR 131 Crores in March 2018 to INR 310 Crores in March 2022.
Source: Screener.com
In such scenarios, where we understand that the sales will increase in the next few years, it is ideal to apply price to operating cash flow metrics. This is because depreciation is a non-cash expense and OCF will add back the depreciation expenses which were initially deducted to obtain net profit.

Source: Screener.com
Companies that can add multiple avenues of growth
When a business is in a expansionary state, it may not be prudent to make use of the P/E ratio.
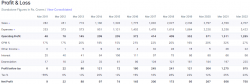
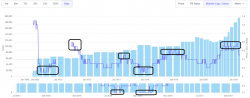
In Jan 2018, the P/E ratio for Deepak Nitrite Ltd stood at 81X. During the same period, the company commercialized the phenol plant for INR 1,400 Crores. However, the P/E was quite high and misleading.
Source: Screener.com
The net block of fixed assets had almost increased by 3X. The profitability of the company increased from INR 79 Crores in March 2018 to INR 1,067 Crores in March 2022.

Source: Screener.com
Forward P/E becomes a better indicator in such instances. It is difficult to estimate the value of the business using the P/E ratio when the business is expanding and is incurring significant growth capex.
Similarly, businesses like Titan which are in a growth stage, are difficult to forecast. Titan keeps adding more and more ventures. Titan wants to grow the Tanishq jewelry business by more than 2.5X in the next 3-4 years.
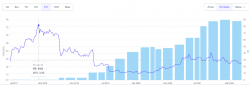
Deep cyclicals
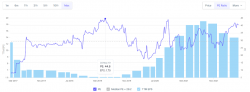
Businesses whose profitability has a positive correlation with the price of a commodity can be construed as deep cyclical. For instance, for Tata Steel Ltd, the profitability depends on the price of steel. Usually when the cycle is down and out, the P/E ratio will look very high. P/E ratio indicates inconsistency and as an analyst, it may not be possible to draw conclusions from the below chart.
Source: Screener.com
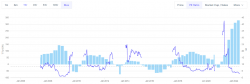
In cyclicals, it is important to look at Market cap to sales and few clear patterns may start emerging.
At the peak of the cycle, market capitalization goes up to 5X of sales. The below chart of market cap/ sales indicates cyclicality.
Source: Screener.com
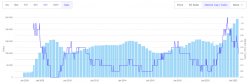
Similarly, we can review the business of Hindalco Industries Ltd. The nature of operations is again cyclical and market capitalization to sales helps in understanding the peaks and troughs during different phases of the business cycle
Source: Screener.com
Valuation of financial companies
Financial companies are usually valued using price to book metric. P/E becomes ineffective and succumbs to its limitations while evaluating banks and financial institutions.
Banks have severe inconsistencies in terms of reporting of their results. Some prudent lenders would prefer to have higher provisioning in their books while some aggressive lenders would restrain from having high provisions. When the quantum of provisions is high, the profitability of the bank gets impacted. Under such circumstances, it wouldn’t be appropriate to compare two banks with different ideologies and approaches.
As assets and liabilities are marked to market on a day to day basis, the balance sheet reflects the true picture of the bank’s operations. In such a scenario, it becomes important to consider price to book as a metric for comparison.
Therefore as an analyst, it is important to understand the circumstances where P/E ratio formula can be used and make necessary adjustments in the statements so as to obtain a realistic figure for comparison.
Other Trending Posts in this Series –
7 things to note if thinking about MBA Finance | Career in Equity Research | Career in Investment Banking
To stay updated about all of our posts on Businesses and Finance Careers – register and create a free account on our website. You will also get access to a free Finance Bootcamp course once you register.