Market outlook
The growth of the aviation industry market in an economy bears a positive correlation with the economy’s growth prospects. As per International Monetary Fund (IMF), India is expected to grow at a healthy rate of 7 percent annually till 2025. In fact, the IMF believes that India’s growth rate is going to be more than China’s during this period.
Industry deregulation since 2004 has been a boon to the aviation industry market in India. There has been a significant increase in the presence of low cost carriers. Domestic and international traffic increased at CAGRs of 14.3% and 9.0%, respectively between FY2004 and FY2020. In the last ten years alone, the total number of domestic and international passengers has grown 2.5 times. The number of domestic airline passengers in FY 2020 (137.2 million) was over double the number of international passengers (66.5 million).

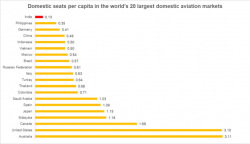
India also has by far the lowest number of international seats per capita among the world’s 20 largest international aviation markets at 0.06, which is less than half that of China.
In FY2010, routes between the six metros (Delhi, Mumbai, Bengaluru, Hyderabad, Chennai and Kolkata) accounted for 41.6 percent of total domestic traffic. This declined to 25.7 percent by FY2020 as air services spread to more and more cities. In the ten years to FY2020, traffic on metro–non-metro routes increased at a CAGR of 15.2 percent, almost twice the 7.7percent CAGR on metro–metro routes, reflecting the under-penetration and potential of non-metro routes. And in the last five years, there has been particularly strong growth (CAGR of 31.2 percent) on non-metro to non-metro routes, albeit off a small base.
A detailed study of the domestic seats per capita indicates that India holds the lowest number of seats. With an increasing purchasing power and a northward movement in private final consumption expenditure as a percentage of GDP, India’s aviation sector will need to increase its capacity.
As per Directorate General of Civil Aviation, the projected domestic and international passenger numbers post a potential for low cost carriers to expand operations.

Supply-side issues, such as airline capacity, can impact traffic in individual years. For example, the exit of Kingfisher Airlines resulted in negative growth in FY2013, while Jet Airways’ closure led to subdued growth in FY2020.
Fuel prices are another exogenous factor that can impact demand. With fuel being the single largest operating expense for airline operators, carriers must fully or partially pass on increases in fuel costs to passengers in the form of higher airfares, which leads to a decline in traffic.
Market Size
According to the World Economic Forum, India’s economic structure is expected to transform from a pyramid structure in which lower-income groups dominate, to one that is largely middle-income.

This structural shift will increase disposable incomes and provide a significant stimulus to discretionary consumption on categories such as travel. Consumer spending is as a result expected to quadruple from USD1.5 trillion in 2018 to USD6.0 trillion by 2030.
Competition Intensity
The airline industry is characterized by an oligopoly market structure, a form of imperfect competition in which a limited number of firms dominate the industry.

Key metrics
Revenue Passenger Kilometers (RPK) or Revenue Passenger Miles (RPM) is a metric that shows the number of kilometers traveled by paying passengers. It is calculated as the number of revenue passengers multiplied by the total distance traveled.
Available seat kilometers (ASK) shows the total number of passenger kilometers that could be generated in order to determine the amount of revenue that comes in compared to the maximum amount.
In short, RPK can be considered as the customer demand ASK is the supply availability.
The passenger load factor is a metric used in the airline industry that measures the percentage of available seating capacity that has been filled with passengers. A high load factor indicates that an airline has sold most of its available seats and is preferred over a low load factor.
The passenger load factor in the Indian market is about ~86 percent in the pre-covid period. This is likely to return back to February 2020 levels.

Registration Open - Analyst Program Click here
Company Overview
InterGlobe Aviation Ltd., doing business as IndiGo, is an Indian low-cost airline headquartered in Gurgaon, Haryana, India. It is the largest airline in India by passengers carried and fleet size, with a 53.5% domestic market share as of October 2021. The business has continued to perform well in spite of the challenges posed by the pandemic.

The management believes that the metro to metro demand still remains soft and hence its focus is on non-metro to metro and non-metro to non-metro where demand is picking up.
Some of the points to note while evaluating the business model are:
- Liquidity Management- Cash burn increasing QoQ and is likely to improve as travel appetite is picking up. Liquidity raising measures from SLBs and credit lines to help strengthen the balance sheet.
- Non metro penetration – In the ten years to FY2020, traffic on metro -non-metro routes increased at a CAGR of 15.2 percent. This is almost twice of the 7.7 percent CAGR on metro-metro routes. The business focuses on the potential of non-metro routes.
- Fleet mix – IndiGo plans to retire 40 to 45 of its A320 Current Engine Option (CEO) aircraft and expects the net fleet to be at ~285. Improved fleet mix to yield substantial cost savings. A321 New Engine Option (NEOs) have 10% lower unit cost compared to A320 NEOs due to more number of seats. Moreover, NEOs are 15 percent more fuel efficient than CEOs.
Drivers & Challenges
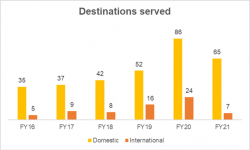
- Increase footprint and global presence – The business got impacted due to pandemic and operations were curtailed. Once the situation improves, the possibility of expansion increases.
- Raw material pricing – Aviation sector is highly dependent on the price of crude oil and any deviation in the price due to geopolitical concerns will impact the gross margins of the business.
![]()
- There is no hedging through commodity derivatives. An increase in input costs can only be recovered through higher fares. Usage of a better fleet will optimize fuel efficiency and drive lower costs. Currently, Aviation Turbine Fuel (ATF) got a price hike of 2 percent and is trading at an all time high of INR 2,254.84 per kilolitre.
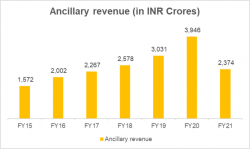
- Focusing on ancillary revenue – Ancillary revenue includes revenue from cargo, special service requests, ticket modifications, in-flight sales and other related services. Ancillary revenue represents a relatively low proportion of total operating revenue for IndiGo. There is a significant possibility of growth. For instance, the contribution of ancillary revenue to total revenue has increased from 11 percent in FY15 to 16 percent in FY21.
- Debt servicing – From April 1, 2019, Indian companies were required to adopt the new accounting standard IND AS 116 instead of IND AS 17, for the treatment of assets on lease for a duration of more than 12 months. The new standard requires that the present value of lease liabilities for the remainder of their lease term are recognised in the balance sheet, together with a corresponding right-of-use asset. In the profit and loss statement. This has resulted in an increase in depreciation/amortization and interest expenses, and a reduction in lease rental payments. However, lease liabilities denominated in foreign currency need to be revalued each year and foreign exchange profits or losses recognised.
- Debt levels have been increasing with time and this becomes a cause of concern considering the high fixed costs associated with the operations of the business.

- Competition – GoAir operates the most fuel efficient narrowbody fleet in India. As of February 2021, 82 percent of GoAir’s narrowbody fleet consisted of the re-engined A320 neo type. This is the highest for an Indian carrier followed by Vistara at 60 percent and IndiGo at 59 percent. SpiceJet is suffering from high net debt and inflows have been impacted post pandemic.
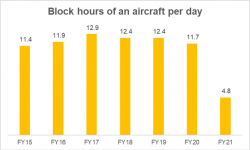
- Block hours – Block hours are the time spent between door close at departure and door opening at arrival. It can be considered as a measure of efficiency (time in flight/ time on ground). An airline needs to optimize the time on the flight and minimize the time on the ground.
- Relaxation of capacity and fare bands- Airlines can now operate at a maximum of 85 percent capacity as against 72.5 percent capacity during the pandemic. The aviation minister has also revised the timeline for dare bands on airline ticket prices, with the bands to now be rolled over in 15 days instead of 30 days. Minimum fare was a challenge as fare buckets have a very high minimum price which restrained demand.
Sunny days are ahead for the IndiGo airlines when it takes off in FY23. Increased vaccination drive, lowering of Covid infections and pick in corporate & revival tourism will lead to revenue growth in the coming days. Passenger traffic to gather pace due to lower infections, the restart of international traffic, revival in corporate, festive & holiday travel.
Other Trending Posts in this Series – DMart Valuation | HUL | Tesla Valuation
To stay updated about all of our posts on Businesses and Finance Careers – register and create a free account on our website. You will also get access to a free Finance Bootcamp courses once you register.


