Nykaa was one of the most talked-about companies this year as IPO was around. However, it has garnered interest since its inception. Through this article, we will understand the market and the business.
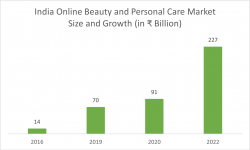
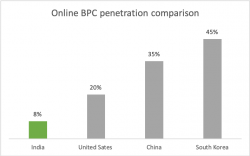
Nykaa is a market leader in the online beauty and personal care market (BPC) operated by FSN E-Commerce Ventures. Online Beauty and Personal Care Markets in India have posted a CAGR of 48% over the last three years, grabbing a market share of about 15% of the India BPC Market as of 2022. However, online penetration of the BPC market in India is much lower than that of developed economies like China and the United States.
Nykaa is engaged in the business of selling beauty, personal care and fashion products through its omnipresent channel. It is the largest player in the online BPC market with a 37% market share. The company sells products online through its mobile application, website, and physical stores. Nykaa’s portfolio includes domestic and international brands and its brands. Company also serves the unorganised BPC space through their Superstore app delivering to 1.1 lakhs transacting retailers in 700 cities as of March 31, 2023. Nykaa’s revenue has grown at an unbelievable CAGR of 70% since 2017.
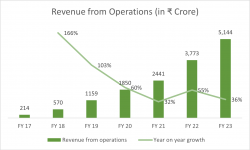
The Company earns revenue from multiple businesses
- BPC – Sale of Product
- Fashion – Sale of Product
- Others
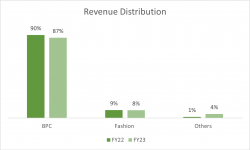
Nykaa – Sale of Beauty and personal care
- Nykaa started its business in 2012 by selling a vast range of BPC products online.
- They currently provide delivery services to approximately 98% of the available pin codes across India. Along with this Nykaa also has 145 physical stores as of 31st March, 2023 in 60 cities. Management has indicated these stores turn EBITDA profitable in less than a year of launch.
- This segment is managed by an inventory-led model within which the company buys products directly from brands or their authorized distributors and sells them on its platforms. This ensures the authenticity of products sold and ensures timely delivery and availability of the product.
- BPC products, especially cosmetics, have one of the highest average retail markups in the retail consumer product space. According to Crowe, the average retail markup on cosmetics in the USA is about 50 to 60%. This ensures room for margin expansion for Nykaa.
Nykaa Fashion: Sale of Apparel and Accessories
- In 2018, Nykaa created a marketplace to sell apparel and accessories.
- Within this segment, Nykaa is trying to establish a niche position by focusing on curation. The company offers the latest season designs at a total price.
- Nearly 88% of this segment follows the marketplace model. Under this model, the brands or their authorized distributors sell directly on Nykaa’s platform, and Nykaa receives a commission on products sold. The marketplace model leads to capital efficiency as trends in the fashion business change quickly and frequently compared to the BPC segment.
- Nykaa’s take rate is 8% which is reasonably lower than other players like Amazon and Flipkart, who have a take rate of 10-15%. Take rate is the commission charged by the marketplace to the seller for facilitating the transaction on its platform.
- Although the online penetration of the apparel market is low, It is a highly competitive market with deep pocket players like Myntra and Jio, thus making it difficult to scale this business.
- Under this segment company sells 2,850+ brands and over 7.0 Mn SKUs across four consumer divisions: women, men, kids, and home.
Nykaa: Other Segments
- Others includes new businesses like NykaaMan, eB2B platform ‘Superstore by Nykaa’, International, LBB and Nudge.
- During FY21 to FY23, the Others category experienced substantial growth at 45% CAGR, mainly as a result of Nykaa’s entry into unorganized offline retail BPC segment through Superstore, the eB2B business.
- SuperStore: Nykaa’s eB2B distribution platform, launched in Q2 FY2022 offers access and expertise in Beauty and Personal Care to underserved markets such as beauty stores, pharmacies, hair salons, and Kirana stores.
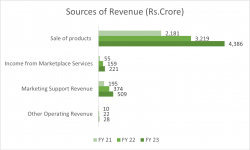
Sources of revenue
- Sale of products – Includes sales of products that the company purchases directly.
- Income from marketplace services – Under marketplace service company receives a commission from sellers who sell products through Nykaa which primarily consists of the fashion business.
- Marketing support revenue is revenue earned from advertising brands on the Nykaa Platform.
- Other operating income primarily includes shipping and delivery charges collected by Nykaa.
- Nykaa has experienced growth in all the above segments.
Registration Open - Analyst Program Click here
What makes Nykaa Unique?
Content Driven Customer Engagement
- Nykaa has created a moat in both BPC and fashion segments through content-driven customer engagement. Firstly Nykaa uses a variety of ways to generate content and then personalizes this content for its users to drive sales of relevant products.
- Earlier, due to the limited availability of beauty and make-up products, the majority of Indian women were unaware of make-up regimes. Nykaa helped fill this gap by providing a wide assortment of beauty products. The company raised consumer awareness and educated consumers on the use and benefits of each beauty product.
Content generation engine

- The strong content engine increases the number of transacting customers and order value and improves Nykaa’s profit margin.
Expanding own brands
- Nykaa also sells its own brands which are manufactured through contract agreements on its channels. Private label brands fetch a higher margin for the company.
- Nykaa has total 27 owned brands including 13 brands under BPC segment and 14 brands under Fashion segment. Owned bands are available on online channels, physical stores and third party multi brand outlets and other online marketplaces.
- The Gross Merchandise Value (GMV) of Nykaa’s 5 owned brands exceeded Rs 1,000 million (Annualized run rate based on Q3FY24 GMV).
- The GMV of owned brands in BPC segment has increased by 40% CAGR between FY20 and FY23, while that in fashion segment has increased by 142%.
Operating parameters
Following are a few important operating parameters used by e-commerce companies –
- Visits- Number of visits to the websites and mobile applications
- Annual Unique Transacting Customers (AUTC) – It is the number of customers who have placed at least one order on its websites, mobile applications, or physical stores during the last 12 months. Nykaa’s AUTC in BPC has grown at a 30% CAGR over FY19-23, this number is 4X in case of the fashion segment. Further company’s omnichannel strategy could increase this number significantly.

- Order per customer – It represents the frequency of orders placed by customers. This has remained steady for the BPC segment over the last 3 years at 3 orders per customer. Orders per customer increased marginally to 3.5 in FY23. The company is trying to increase this by using content-driven marketing.
- Average Order Value (AOV) – AOV had seen a sharp jump in FY21 when Nykaa increased the minimum order value for availing of free delivery. AOV has remained constant since then. The AOV of the fashion business is higher than that of the BPC.

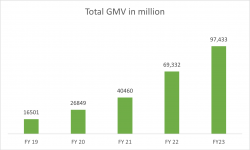
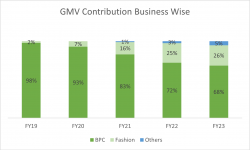
- Gross Merchandise Value (GMV) is the monetary value of orders inclusive of taxes and gross discounts, if any, across websites, mobile applications, and physical stores before product returns or order cancellations and including sales to and through third-party channels. GMV is a function of all the above operating parameters. Between FY19 and FY23, Nykaa’s GMV increased by a staggering 56% CAGR. GMV contribution from BPC continues to decline, while fashion and other segments are increasing.

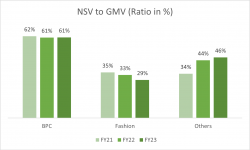
- NSV to GMV – Net Sales Value (NSV) is defined as GMV minus discounts, returns, and cancellations. A lower NSV to GMV indicates a high level of return & cancellation or higher discounts. The NSV to GMV ratio for BPC is stable at 60%, indicating that returns and discounts account for 40% of GMV. The NSV to GMV ratio of the Fashion business has been steadily decreasing, and this is concerning.
- Revenue to NSV – A higher Revenue to NSV is seen in the BPC segment due to advertising revenue. The fashion business’s NSV differs from its revenue due to the marketplace model, which only accounts for commission revenue.

What are Nykaa’s cost drivers?
- The three major cost items for Nykaa are employee expenses, marketing expenses, and freight costs:

-
During FY 23, the employee cost increased by 51% due to an increase in employee numbers to 3177 as of March 31, 2023 from 2764 as of March 31, 2022, which was primarily due to new initiatives mostly in technology, eB2B, and store expansion.
-
In FY23, marketing expenses increased by 23%, driven by increased spending on acquiring new consumers and advertising campaigns, which helped achieve higher order-to-visit conversions.
- Freight cost is directly related to the volume of orders processed through Nykaa’s platform.
- As Nykaa gains scale, each line item would reduce, resulting in higher profitability.
What about profitability?
- Nykaa is one of the few profitable new-age companies. Despite achieving EBITDA Breakeven in FY19, it turned PAT positive in FY21 as a result of marketing budgets being reduced due to the pandemic. As marketing expenditures returned to their original levels, the company has not been able to maintain its margins since FY21.

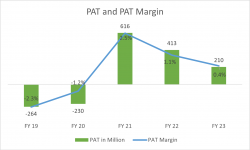
- Nykaa is a new generation profitable and high-growth company that has revolutionized the online BPC market.
Conclusion
We have seen Nykaa achieve remarkable growth in the past. Nevertheless, Nykaa’s future growth is expected to be driven by growth in private labels, scaling up of the fashion segment and SuperStore, and content-driven growth. The market is going to be an interesting one, and hence it is going to be crucial how Nykaa thrives, and delivers.
Other Trending Posts in this Series – DMart Valuation | HUL | Tesla Valuation
To stay updated about all of our posts on Businesses and Finance Careers – register and create a free account on our website. You will also get access to a free Finance Bootcamp course once you register.


