Adobe Company Analysis – Simplified
-
By Parth Parikh

Have worked in the financial services industry for around 8 years now, and main areas of work have been Sector Research, Risk Management, Financial Modelling and Wealth Management.
Involved in the developoing content as a part of training in various Organizations like Kotak Securities, Motilal Oswal, Nippon Mutual Fund(erstwhile Reliance Mutual Fund), JPMC, Crisil.


Are you aware of Adobe Acrobat Reader, and I am reasonably certain that you must have used it at least once? Here are more amazing facts in the Adobe company analysis and its products:
Over 90% of the world’s creative professionals use Adobe Photoshop.
Adobe Creative Cloud mobile apps have been downloaded over 449 million times.
More than 300 billion PDFs were opened in Adobe products in the last year.
More than 8 billion electronic and digital signature transactions were processed through Adobe Document Cloud in the past year.
Adobe Scan is the leading scanning app on iOS and Android with more than 110 million downloads and 1 billion documents created.
With Adobe Analytics, we analyze more than a trillion visits to sites and over 100 million SKUs.
And finally,
Every 1 million Adobe Sign transactions save 105 million liters of water, 31,000 trees, and the equivalent of taking 2,300 cars off the road for a year – plus reducing costs by more than $7.2M.
Amazing. But why are we talking about Adobe?
Because Adobe is one of the pioneers of the subscription-based economy, let’s deep dive into it.
The Journey
The company decided to move from a product-based system to a subscription-based system when Shantanu Narayen took over the company’s CEO in 2007. In 2007, the company generated $3 Bn with Products contributing 96% with a margin of 23%.
Then the decision of movement and honestly, it was a tough one (amidst the 2008 crisis), the subscription revenue in 2008 was just 1%. The company took time to create an ecosystem and product. Post the launch of creative cloud in 2011, they became aggressive and started pushing the subscription products.
As a result, sales declined by 10% and remained at Pre 2011 figure for a good 4 years. The revenues exceeded 2011 levels only in 2015—net margin reduced to just 6% from previously 20+%.
Cut to 2019, Rev from Subscription SaaS is now 89% and from Products is just 6% (complete turnaround in a decade), with the net margins hovering around 27%
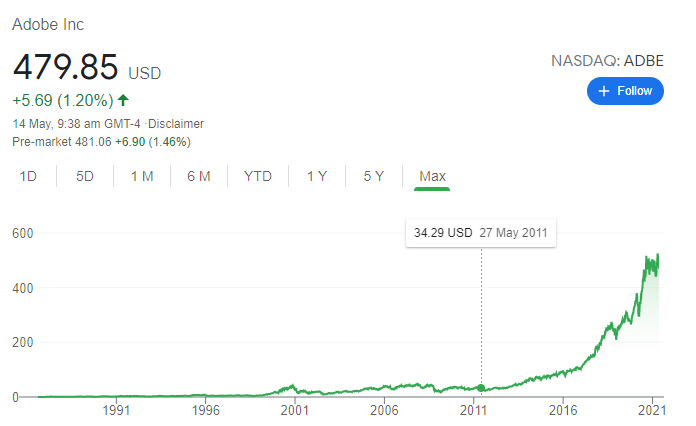
The result of the transformation is evident in the share price growth: 14X in one decade.
So in this Adobe company analysis, let’s understand the Revenues part of the Business.
The company generates revenue from three segments:
- Digital Media
- Digital Experience and
- Publishing and Advertising
Digital Media:
Adobe’s Digital Media segment includes Creative Cloud, Document Cloud business (Photoshop, Illustrator, Acrobat, Adobe Sign and Adobe Scan). Primary revenue generation through this segment is via Subscriptions.
Digital Experience:
This segment is sold to enterprises looking for turn-key solutions for advertising and marketing. This segment includes products like Analytics Cloud, Marketing Cloud etc. Primary revenue generation through this segment is via Subscriptions.
Publishing and Advertising:
Adobe’s Publishing and Advertising segment contain legacy products and services that address diverse market opportunities, including eLearning solutions, technical document publishing, web conferencing, document and forms platform, web application development, high-end printing and Advertising Cloud
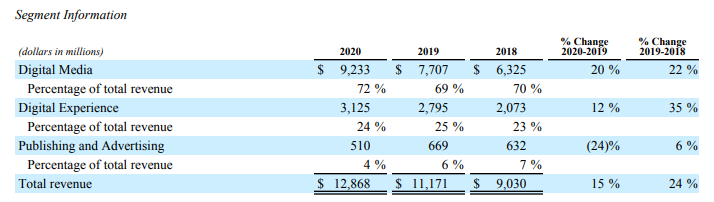
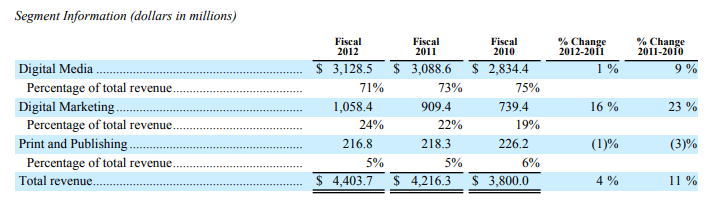
.Digital Media Segment is the most important segment for Adobe, with around 70%+ revenue generated from this segment.
Publishing and Advertising Segment generates less than 5% of Adobe’s revenue.
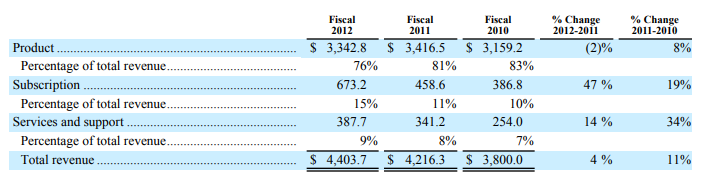
The split has stayed consistent over there years now. The below image showed the segmental split a decade ago.
Registration Open - Analyst Program Click here
So what is so interesting about Adobe’s revenues?
The below image will clarify everything 🙂
The revenue generated through the subscription business now stands at a whopping 90%.
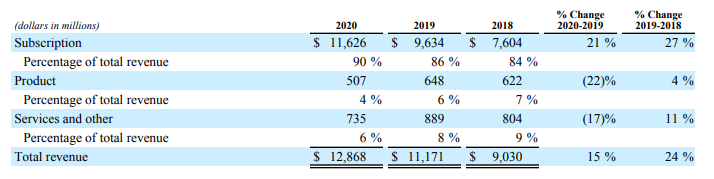
Exactly a decade ago, it was just over 10%. From 10% to 90% – shift in business at that sale is just amazing.
And the best part is, the subscription business is still growing at 20%+ YoY.
And what about Adobe’s Profitability?
Honestly, at the gross level, the company is extremely profitable. And the margins are 87%, and Adobe has maintained that irrespective of the business shift.
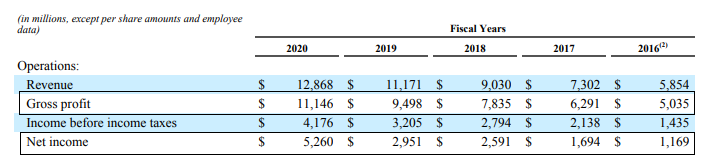
At a net level, the margins are extremely healthy – around 30%. FY 2020 is an exception, and the net margin is over 40% – primarily due to lesser costs due to pandemic.
Was it simple to move the Business Strategy for Adobe?
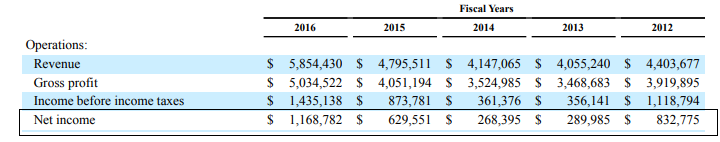
Absolutely not. No one believed that they would be successful – not even the markets. The shares did not generate any return for a period of 7-8 years (between 2008 and 2014). See the image below.
Margins fell to sub 10% in FY 2013 and Fy 2014 before picking up again.
So nothing comes easy 🙂 even to Adobe!!! It was difficult and painful.
And after all, is India important?
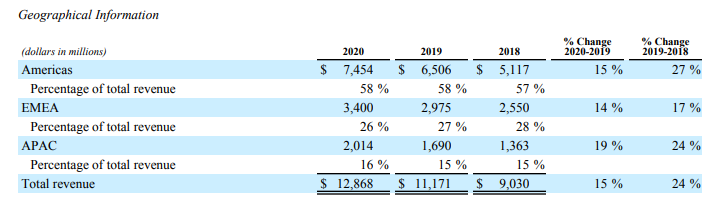
Americas has been Adobe’s primary market, with 58% of the total revenue generated from this region, plus it is growing at a healthy rate.
Europe, Middle East and Africa (EMEA) is the second most important region for Adobe. It makes up 26% of the total revenue.
Asia Pacific (APAC) region makes up just 16% of the total revenue, with Japan as the most important market. APAC has seen the fastest growth in revenue with a CAGR of 22% over the past 2 years. India not so much, and unlikely it will become a primary market.
The point we can drive from this story is, as an Investor/Analyst, it is important to see the business, direction, and metrics as an Investor/Analyst. In 2013, subscription revenue grew 69% and then 83% the next year. It was the inflexion point. Stock price tells you that. In hindsight, it is easy to say that, but how many would have held on to the stock since 2008 after a dip and no returns for 7 years?
Other Trending Posts in this Series – Spotify | Netflix | Amazon
Stay updated about all of our posts on Businesses and Finance Careers – register and create a free account on our website. You will also get access to a free Finance Bootcamp course once you register.
-
About the Author
Have worked in the financial services industry for around 8 years now, and main areas of work have been Sector Research, Risk Management, Financial Modelling and Wealth Management.
Involved in the developoing content as a part of training in various Organizations like Kotak Securities, Motilal Oswal, Nippon Mutual Fund(erstwhile Reliance Mutual Fund), JPMC, Crisil. -
-
Register and get regular updates of new Blogs and access to Free Courses
-