
Excel Simplified – VLOOKUP Function and multiple outputs
-
By Parth Parikh

Have worked in the financial services industry for around 8 years now, and main areas of work have been Sector Research, Risk Management, Financial Modelling and Wealth Management.
Involved in the developoing content as a part of training in various Organizations like Kotak Securities, Motilal Oswal, Nippon Mutual Fund(erstwhile Reliance Mutual Fund), JPMC, Crisil.


One of the widely used functions in Excel is the VLOOKUP function. The function helps us to find a specific value from the defined Excel Dataset and then throws output based on the column defined. At the end of this post, you will find the Excel working file for this function.
Before we deep down further, let’s try and understand inputs to VLOOKUP Function.
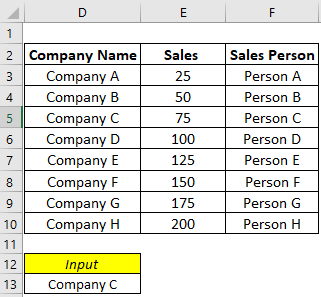
Dataset comprises of Company Name, Sales and Corresponding Sales Person
VLOOKUP Function Structure
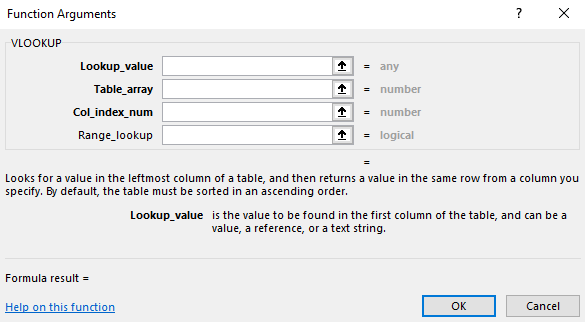
Lookup Value: This is the value that we are trying to search in the Excel Table. This can be a text value or cell reference from the existing excel sheet. Here as per example, we can either put the value as D13 (cell reference) or mention “Company C” (static value).
Table Array: This is the table range in which we are trying to find Lookup Value. The input over here will be Tabe Range D2:F10.
Column Index Number: We can define which column we need the output from the selected Excel Table. If we want to output as Sales Value, then the numeric value should be 2 (as Sales Value is in 2nd Column in the Table Defined, which is D2:F10), and if we want to output as Sales Person, then the numeric value should be 3.
Range Lookup: If we are trying to search a specific value, then we have to use FALSE, and if we are trying to use an approximate match, then we have to use TRUE.
Since here we are searching exact Company value hence it should be FALSE. We will cover another example that will demonstrate the use case of TRUE as an input.
Registration Open - Analyst Program Click here
Problem Statement: How to get multiple outputs from the VLOOKUP function?
Think of a scenario: You have selected Company C (From the list, check Excel File), and for your selection, you need output from multiple columns (Sales Data and Sales Person).
W can use two approaches here –
Approach 1
Use two formulas, one for Sales Data and another for Sales Person
Sales Data: =VLOOKUP(D16,$D$6:$F$13,2,FALSE)
Sales Person: =VLOOKUP(D16,$D$6:$F$13,3,FALSE)
Approach 2
Use VLOOKUP to generate multiple outputs using the formula only once. That means VLOOKUP will be used as an Array Formula.
=VLOOKUP(D16,$D$6:$F$13,{2,3},FALSE)
Here we have used Column Input using curved brackets. Excel interprets that if the value is found, then the output should be Column 2 and Column 3.
Curious about how to use this functionality further!!!
Download the excel file and check the sheet “Sum Multiple Columns”, where we have used VLOOKUP with SUM function to fetch data from multiple columns and then sum those numbers.
Note: At times, in the older version of excel – the above-mentioned formula doesn’t work directly. So in that scenario, edit the formula by pressing F2 and then press Ctrl + Shift + Enter simultaneously. This allows Excel to transform the formula into Array Function, and you will see the output.
***** Download the Working file for VLOOKUP function here – Download *****
To stay updated about all of our posts and webinars on Businesses and Finance Careers – register and create a free account on our website. You will also get access to a free Finance Bootcamp course once you register.
Other Blogs in the Excel Series – Dynamic Dropdown Function
-
About the Author
Have worked in the financial services industry for around 8 years now, and main areas of work have been Sector Research, Risk Management, Financial Modelling and Wealth Management.
Involved in the developoing content as a part of training in various Organizations like Kotak Securities, Motilal Oswal, Nippon Mutual Fund(erstwhile Reliance Mutual Fund), JPMC, Crisil. -
-
Register and get regular updates of new Blogs and access to Free Courses
-