The FMCG Valuation Puzzle
-
By Peeyush Chitlangia

Peeyush Chitlangia is the founder of FinShiksha. An Alumnus of IIM Calcutta & MNIT Jaipur, Peeyush has been in the financial services industry for the last 19 years & has extensive exposure to Equity Research & Financial Modeling. With more than 200,000 man hours of teaching experience, he has trained nearly 25000 participants across organizations and campuses

Disclaimer: These notes are purely for the purpose of financial analysis and education. These are not to be construed as recommendation to either buy or sell any asset class or security.
The FMCG Valuation Puzzle
In the last 12 months, Hindustan Unilever’s profits have been Rs 5069 crore. The company’s market cap is now north of Rs 300,000 crore, giving it a trailing P/E ratio of more than 60. During the same period, Britannia clocked a profit of Rs 952 crore, against a market capitalization of Rs 65,000 crore, giving it a P/E of nearly 70. Nestle also had the same story. Marico trades at a trailing P/E of nearly 50. In fact, if you were to run a short quick screening for companies with more than Rs 30,000 crore market capitalization, and a P/E of more than 35, nearly 25% of the resulting companies would be from the FMCG space. Dabur, Godrej Consumer, United Spirits, Asian Paints, all of them would fall in this bracket.
What makes valuations sustain at such rich levels in these companies? They have always been valued richly, and do not seem to de-rate despite such high valuations. A look at some of the numbers tells about the story.
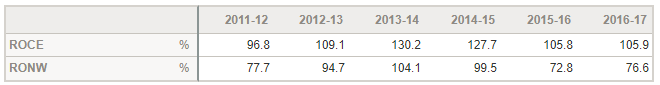
This is what HUL’s ROE and ROCE look like (from HUL’s website)
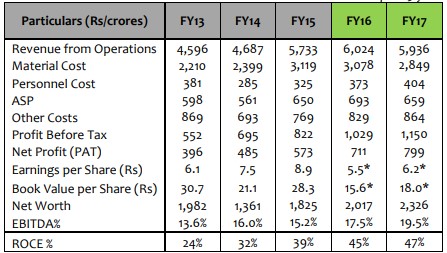
Marico’s financials for the last 5 years look like this (from Marico’s website)
A screen run from www.screener.in gives the following information
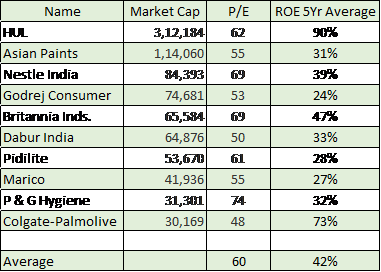
Not only have the companies shown strong Return on Equity numbers on average, their growth has been superior too. Between 2012 and 2017, HUL profits have gone up nearly 1.8 times, Marico’s nearly 3 times, Dabur nearly 2 times, and Britannia nearly 5 times. This would imply a CAGR in profits of between 12% to 37%!
So clearly these companies have shown reasonably good growth with a very stable ROE for the investors. The picture gets more interesting if we look in the returns of the FMCG companies over the past 15 years. For this purpose, we pick the BSE FMCG index, and calculate 5 year rolling CAGR for the year ending values. This means that we take the index values on Dec 31 every year, and compare them to the value 5 years hence. Thus, 31st Dec 2000 is compared to 31 Dec 2005, 31 Dec 2002 is compared to 31 Dec 2007 and so on. The results are nothing short of stunning! Compare this to the other sectors for whom similar calculations are done.
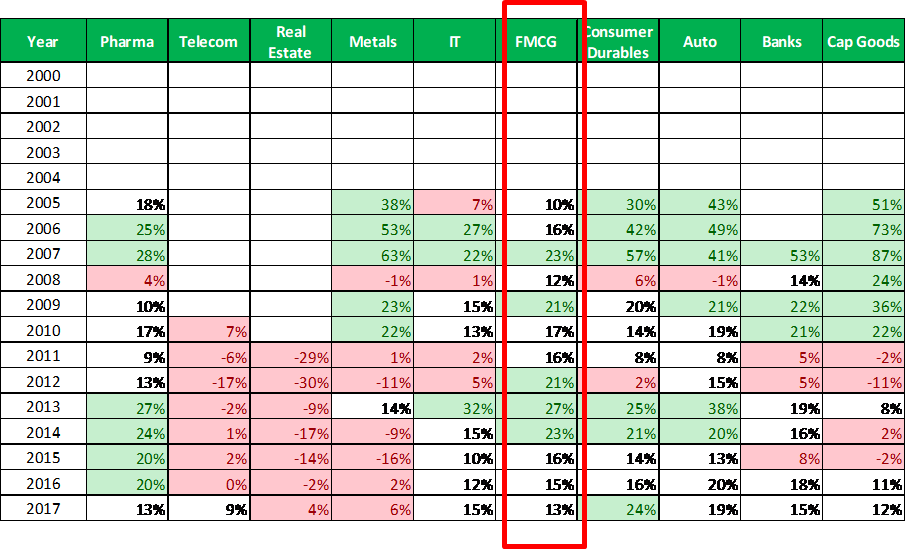
In these calculations, returns above 20% CAGR are shown in green, while those below 8% CAGR are shown in red. FMCG is the only sector that shows no red period. In fact, the lowest CAGR one would have made in FMCG is 10%, while the highest is 27%. Note that these are annual returns, and not absolute numbers.
So basically, we infer the following
- Variability in FMCG returns is very little. In fact, if you had invested in the FMCG index at the end of the year in any of the past 15 years, and held for 5 years, you would never have lost money. Moreover, you would have easily beaten bank returns, with nearly negligible risk, even considering that we had 2 big equity market crashes in 2000 and 2008. Imagine an investor who had replaced her debt funds / bank fixed deposits with the FMCG index. She surely would have been very happy!
- Growth has been very steady in these stocks, and they continue to demonstrate good growth even now. This is driven by the consumption boom in India, and the fact that these are non-discretionary in nature.
- Return ratios for stakeholders have been stellar, ensuring that stakeholders would continue to flock these stocks.
- These are very low capital intensity companies, along with high entry barriers created because of the brand building by the companies
- Finally, companies do not engage in direct price war, rather try to outspend each other on marketing and advertisements. This creates a healthy profitability scenario in the industry.
It is difficult to find such a combination. This sector was a no-brainer as an investment in the last decade, and the risk in this sector mirrors than of debt as an asset class, given the stable nature of business and largely domestic consumption led demand. It is even more astonishing that India has just 2 FMCG Mutual Funds, and both have an AUM of less than Rs 1000 crore each! For a sector performance as remarkable as we have seen, it is surprising that the fund industry has also not bet big on this sector. Maybe because market participants like sectors which are more interesting and can be pitched as flavour of the period, rather than a slow steady performer like FMCG. It’s always more interesting to create an infrastructure fund than an FMCG fund, since the story seems more fascinating, than the boring and completely stable nature of FMCG!
It also probably points to what drives P/E ratios. Maybe a P/E of 50 is not always expensive, as is taught by a lot of textbooks. We have never ever seen these stocks at very low P/E multiples, and as long as they show the same characteristics, it is unlikely that we will. So when we see an FMCG stock at a multiple of 50, rather than saying it is expensive, maybe the correct question is – “Why does is trade at this? And will it sustain this?” This may lead to better answers than just ignoring these stocks since the P/E appears high, and surely better long term investment decisions!
-
About the Author
Peeyush Chitlangia is the founder of FinShiksha. An Alumnus of IIM Calcutta & MNIT Jaipur, Peeyush has been in the financial services industry for the last 19 years & has extensive exposure to Equity Research & Financial Modeling. With more than 200,000 man hours of teaching experience, he has trained nearly 25000 participants across organizations and campuses
-
-
Register and get regular updates of new Blogs and access to Free Courses
-